
Activity Dashboard
Use the Activity Dashboard to report on learner engagement and progress.
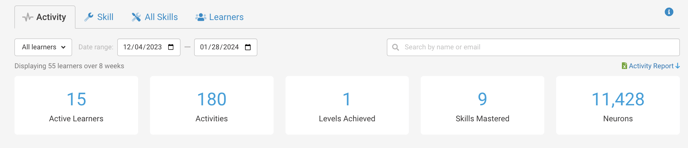
Active Learners: This number indicates the total number of learners who have had any activity in the platform during the date range selected.
Note: This number does not indicate the total number of learners in a selected group or company. The total number of learners selected is indicated below the group filter: "Displaying 55 learners over 8 weeks."
Activities: Total learning activities completed indicates the total number of activities the selected learners completed during the date range selected. A learning activity includes mastering a skill, reviewing a skill, or answering questions based on an "Ask Chip" search.
Levels Achieved: Total number of instances where the selected learners mastered all of the skills in a level.
Example: John Learner mastered all the skills in his "Data Analyst" level assigned to him by his manager.
Skills Mastered: Total number of skills mastered for the selected learners. When a skill is mastered, the learner has demonstrated 100% proficiency by either studying resources and answering questions with progressive difficulty or tested out of the skill.
Example Skill: "Discovering AI."
Neurons Earned: Total number of neurons earned for the selected learners during the selected date range.
Note: Neurons are the points QuantHub uses for gamification. The higher the Neuron count, the higher the activity.
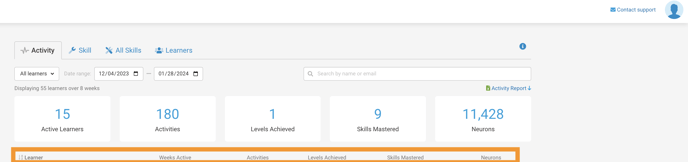
Column Titles
![]()
Learner: Names of the learners selected. You may filter this row in ascending or descending alphabetical order.
Note: Downloading the report will provide the learner's email address in addition to name.
Weeks Active: Total number of weeks the learner has engaged in a learning activity. Weeks begin on Monday and end on Sunday.
Activities: Total number of activities the learner has completed during a selected date range. A learning activity includes mastering a skill, reviewing a skill, or answering questions based on an "Ask Chip" search.
Levels Achieved: Total number of instances where the selected learners mastered all of the skills in a level.
Example: John Learner mastered all the skills in his "Data Analyst" level assigned to him by his manager.
Skills Mastered: Total number of skills mastered for the selected learners. When a skill is mastered, the learner has demonstrated 100% proficiency by either studying resources and answering questions with progressive difficulty or tested out of the skill.
Example Skill: "Discovering AI."
Neurons: Total number of neurons earned by the learner during the selected date range.
Note: Neurons are the points QuantHub uses for gamification. The higher the Neuron count, the higher the activity.
Filtering and Sorting
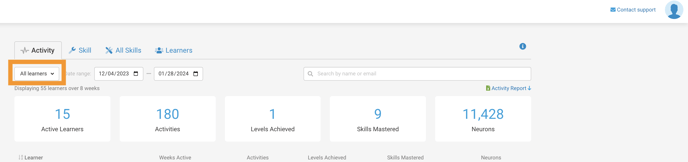
Filtering by Group: You may select all learners or by learner group defined by the teams created by Company Admins. Groups can be defined by company admins in any way that benefits their company, whether that be by division, role, function, etc. Designated managers can view their group's insights.
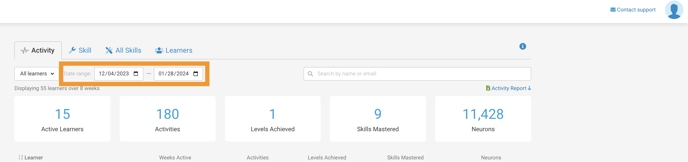
Date range: Select any date range from a Monday through a Sunday. Consistent week start and end dates are necessary for the Weeks Active metric. The selected date range has a minimum of one week.
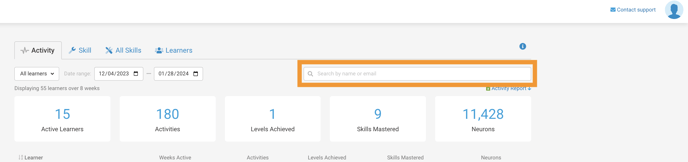
Search: Begin typing a learner's name or email to view their individual statistics.
Sort each Column: Each column is able to be sorted in ascending and descending order.
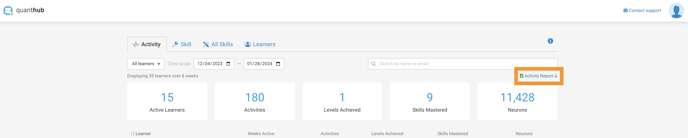
Downloading a Report
1. Set filters to the preferred learners and dates.
2. Download the report as a CSV.
Reports include all information visible on the dashboard AND emails and groups the learners belong to.
An example of one of the reports you can download, (i.e., "Activity Report):
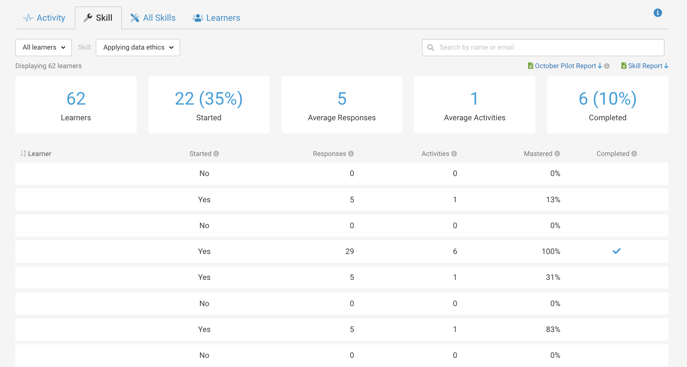
Skill Dashboard
Use the Skill Dashboard to report on the progress and achievements for select groups or users per skill.
Filtering and Sorting
Filtering by Group: You may select all learners or by learner group defined by the teams created by Company Admins. Groups can be defined by company admins in any way that benefits their company, whether that be by division, role, function, etc. Designated managers can view their group's insights.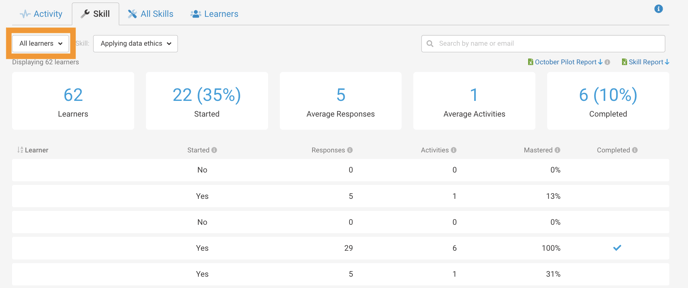
Filtering by Skill: View insights according to all possible skills.
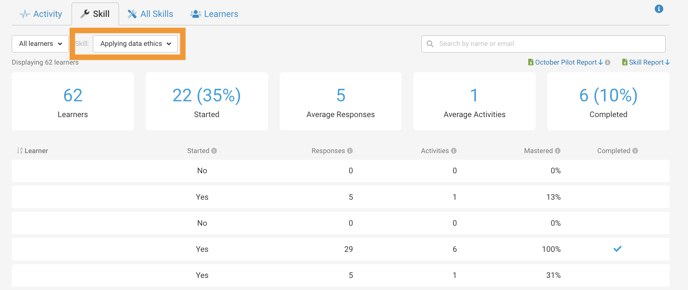
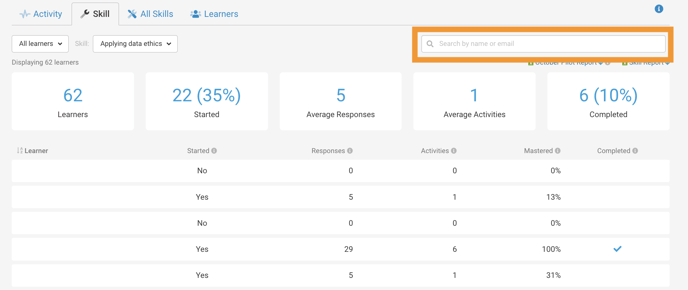
Search: Begin typing a learner's name or email to view their individual statistics.
Sort by Column: Each column is able to be sorted in ascending and descending order.
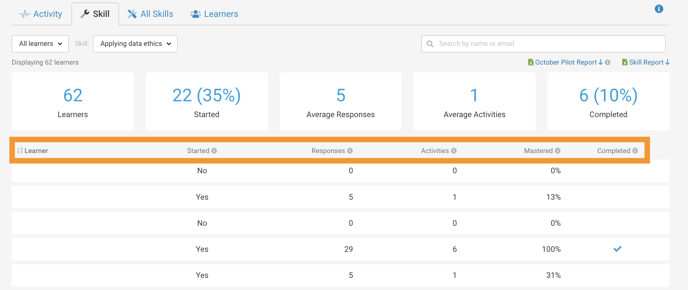
Students (Learners): This column will display a list of all students unless you choose a specific group from the drop-down menu at the top of your insights.
Started: To start a skill, the learner must provide and submit a response or answer.
Responses: A response is the learner's selected or typed answer in reaction to a question, scenario, or activity.
Activities: An activity is completed if a learner meets one of the following criteria:
- Lost all three lives
- Answered five questions correctly
- All questions have been answered in a scavenger hunt
- All questions have been answered, or the time allotted for a skill check/review activity has expired.
Mastered: This percentage demonstrates the maximum skill strength a learner has achieved.
Complete: This metric visually represents with a check mark whether the student has successfully attained a skill strength score of 100%.
Downloading Skill Reports
1. Set filters to the preferred learners (and skill for the "Skill Report").
2. Download the desired report as a CSV.
Reports include all information visible on the dashboard AND emails and groups the learners belong to.
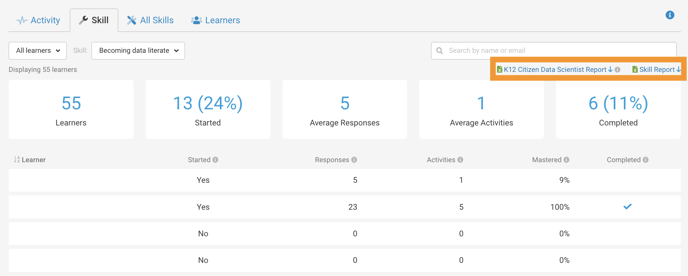
The first report (in this case, "K12 Citizen Data Scientist Report,") will export data for all skills within your company or school's default path. The "Skill Report" will offer data ONLY on the skill that has been selected.
The default learning path for your company or school is only accessible to admin. When exporting this report, only the default path's skills will be visible and other paths will not be included.
Skills Insights
Use the All Skills dashboard to report on the progress and achievements for select groups or users for all skills.
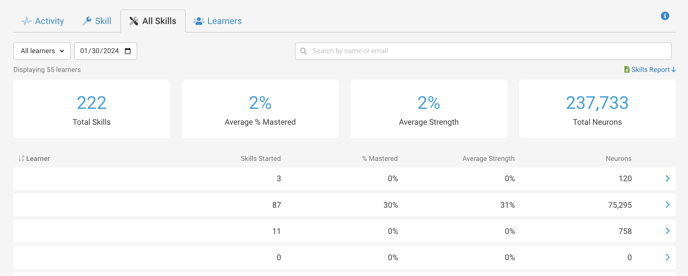
Total Skills: These are the total skills that can be learned in QuantHub, (i.e., 222 total skills).
Average % Mastered: This percent metric indicates the number of mastered skills out of the total possible.
Average Strength: Strength indicates a learner's skill mastery with 100% skill strength, meaning the learner has mastered a skill. This metric is an average of the selected learners' skill strength in the form of a percent.
Total Neurons: This number indicates the total neurons earned by the selected learners for all skills.
ColumnTitles
Learner: Names of the learners selected. You may filter this row in ascending or descending alphabetical order.
Note: Downloading the report will provide the learner's email address in addition to their name.
Skills Started: Total number of skills started by individual learners.
Note: Remember that this will show only the number skills started out of the level selected from the filters found in the "Skill" tab.
% Mastered: Percent of skills mastered out of their total, according to the filter set.
Average Strength: Skill strength indicates a learner's skill mastery with 100% skill strength meaning the learner has mastered a skill. This metric is an average of the learner's skill strength in the form of a percent.
Neurons: Total neurons a learner has earned while learning the skills selected from the filter.
Learners Dashboard
Use this dashboard to quickly view important dates for each learner.
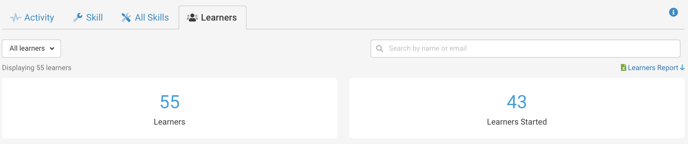
Learners: Total number of learners selected according to the group selected in filter.
Learners Started: Total number of learners who have earned at least 1 Neuron, beginning their learning journey. Aim for the total number of learners to match the learners started.
Column Titles
![]()
Learner: Names of the learners selected. You may filter this row in ascending and descending alphabetical order.
Note: Downloading the report will provide the learner's email address in addition to name.
Account Created: This date indicates when the learner's account was created.
Last Active: This date indicates when the learner last interacted with the QuantHub learning platform.
Active Level: This indicates what level the learner is currently learning.
Level Unlocked: This date indicates when the learner unlocked their current level.
Use this metric to see the most recent level-ups for competitions, rewards, and recognitions.